the map is not the territory
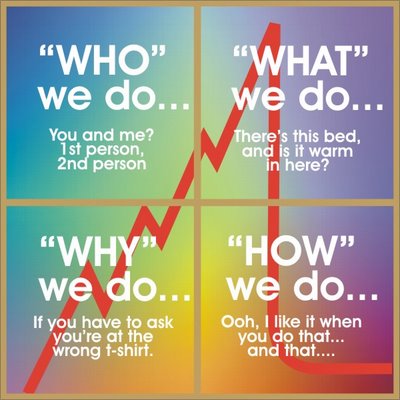
Data visualization should portray this "life" in data that it represents. This calls for visualization that goes beyond standard graphs, that seem to capture the factual part of the data and disregard all else a lot of the time. The numeric value of a data point is only part of the story. Don't forget the who, what, when, where and why.
Source: FlowingData - One Death is a Tragedy; a Million is a Statistic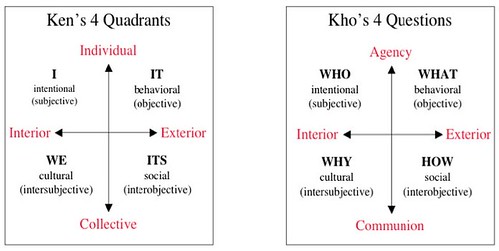


No comments:
Post a Comment